What’s new in Navigator
Navigator is our innovative software platform for assessing social and emotional learning and tracking each child’s progress. Share insights, progress, shifts and changes that occur through being part of the programmes.
NEW Families Together Programme data tracking

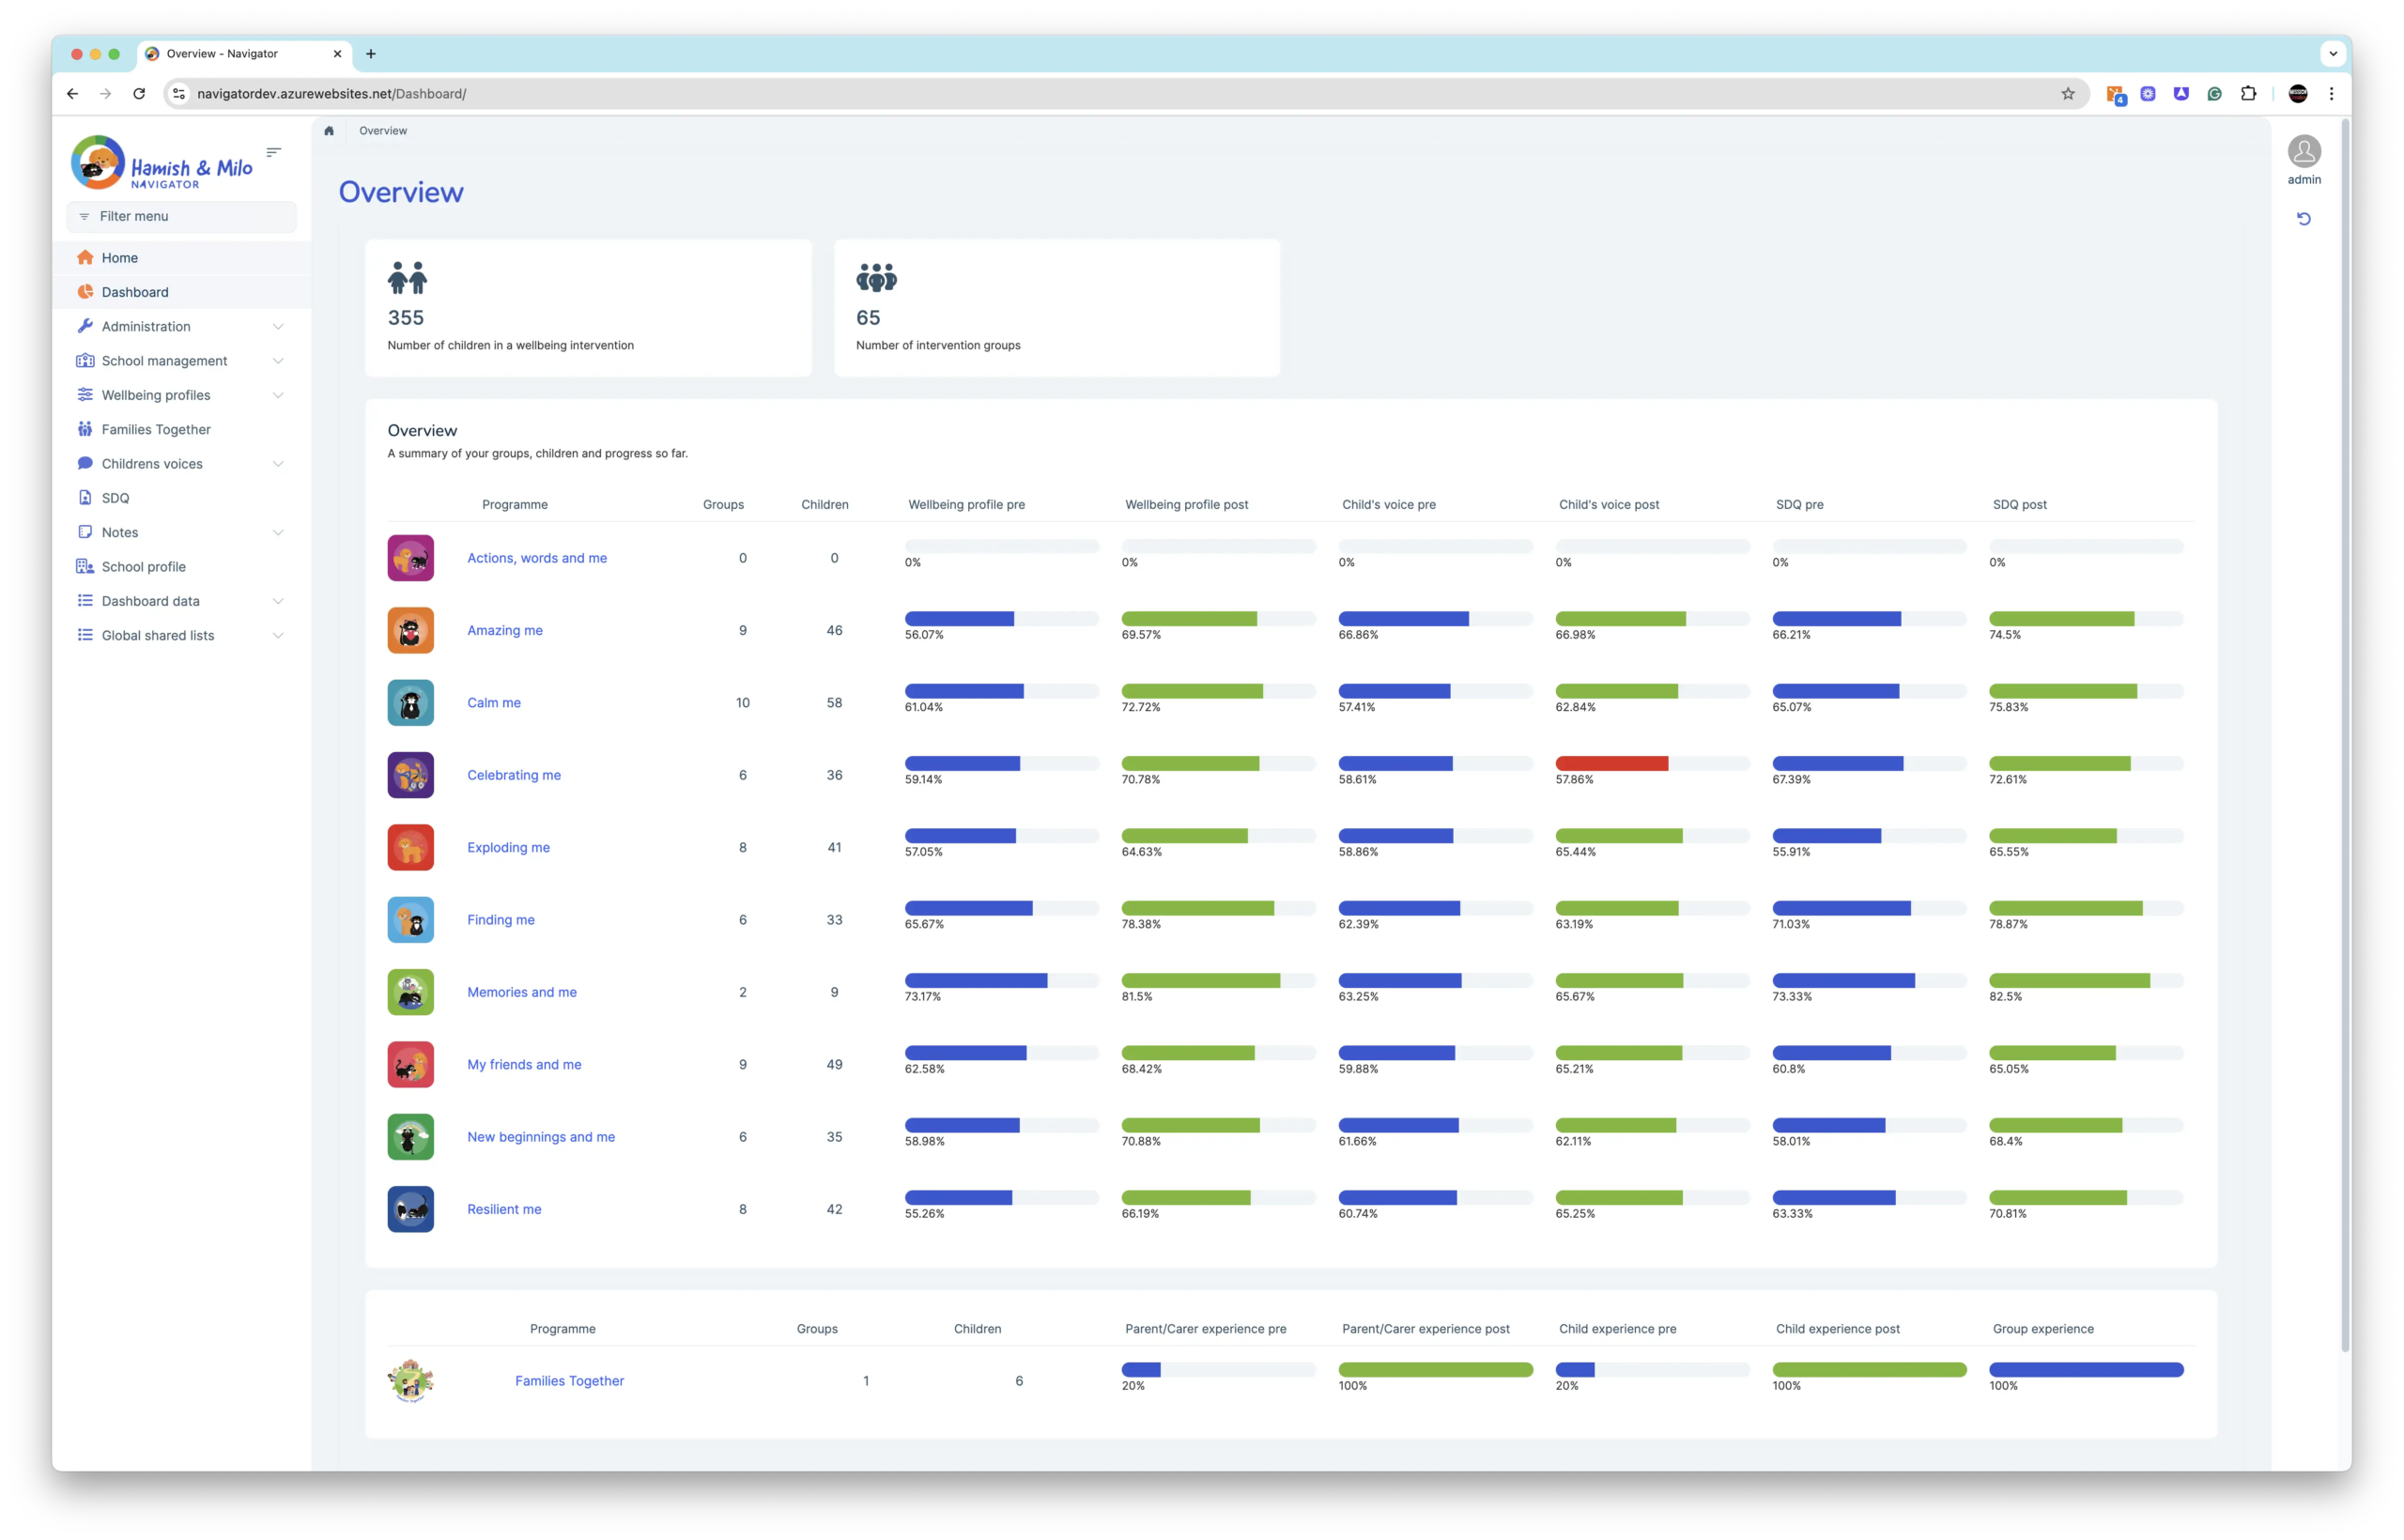
You can now track the impact of the Families Together parent and carer programme in Navigator, alongside your other Hamish & Milo Programme intervention groups. Navigator treats Families Together just like any other programme, using our Family Voice questionnaire:
If you have any questions please email navigator@hamishandmilo.org

NEW Child Demographics
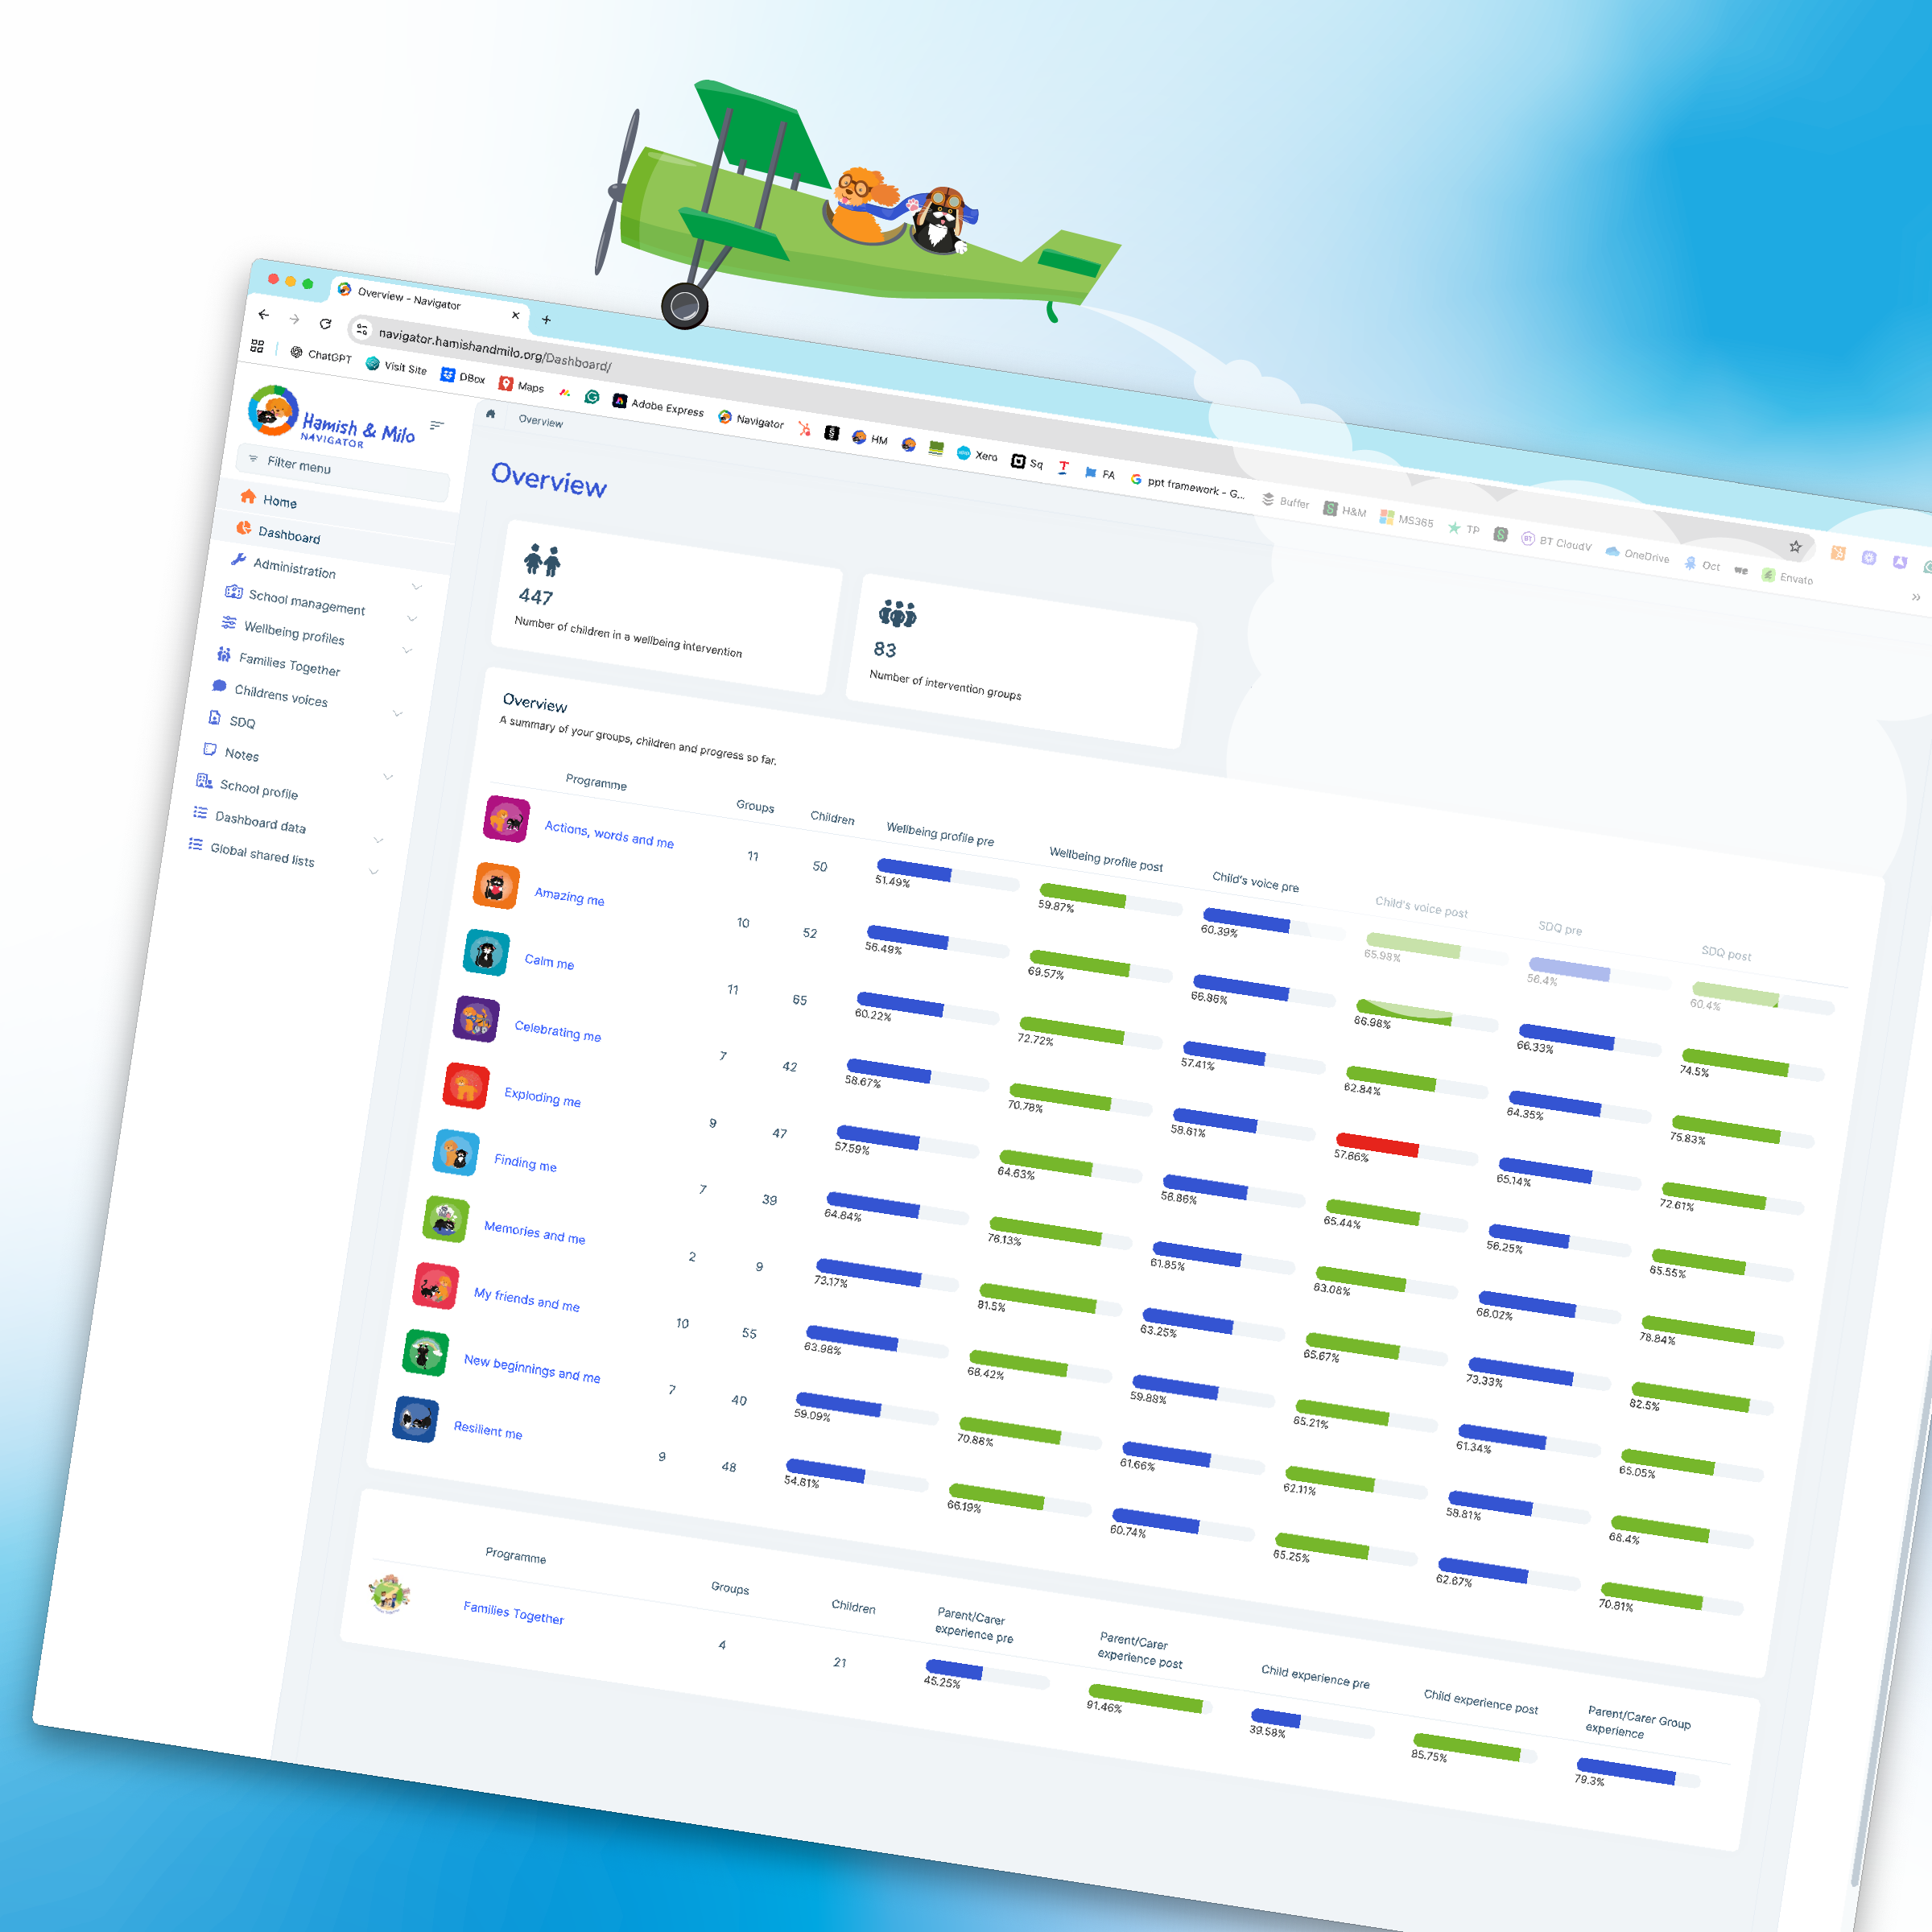
Navigator has been updated to make it easier to view and understand child demographic data alongside wellbeing outcomes. These updates allow you to explore who is accessing provision and how impact is demonstrated, at different levels, depending on what you need to report or review.
Child demographic data can now be viewed at three levels:
Whole school level
From the Dashboard overview, you can see aggregated demographic data for all children who have taken part in any Hamish & Milo intervention across your school. This provides a high level picture of reach and need across your setting.
Programme level
When you select a programme, for example Amazing Me, demographic data updates to show all children who have participated in that programme. This supports programme level evaluation and comparison across different types of provision.
Group level
Within each programme, you can drill down further to individual groups. This view shows the demographic profile and outcomes for children in that specific group, supporting targeted reporting and review.
In each instance, simply click ‘Child Demographics’ at the top of the screen.

At each level, Navigator displays demographic insights including age, gender, ethnicity, and contextual factors such as SEND, EHCP, FSM, LAC, and social worker involvement. These sit alongside pre and post measures, allowing you to view participation and progress together.
This structure supports flexible reporting, whether you are reviewing whole school provision, evaluating a specific programme, or evidencing the impact of a targeted group intervention.
NEW Child Summary Dashboards
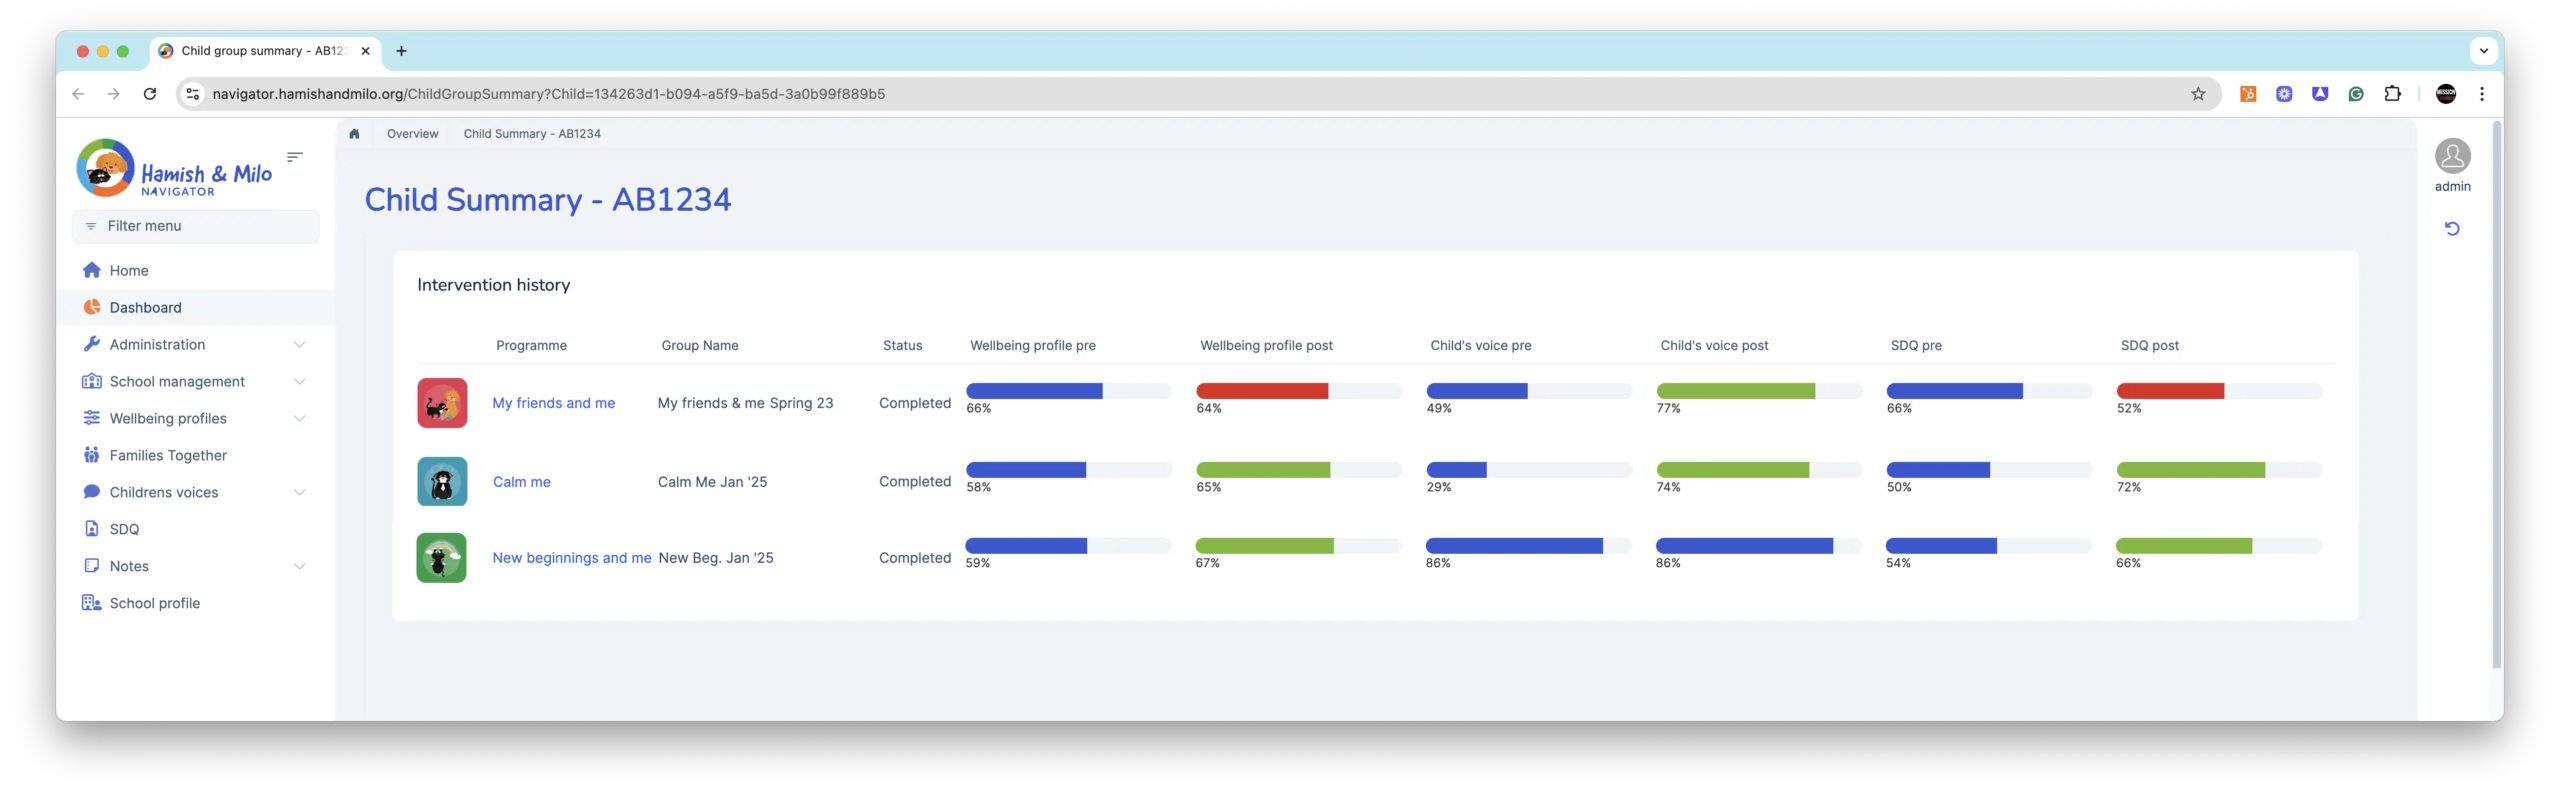
You can now view a Child Summary Dashboard showing data from all the programmes an individual child has participated in. This gives you a complete overview of each child’s progress, wellbeing development, and the support they’ve received – perfect for reporting and Ofsted!
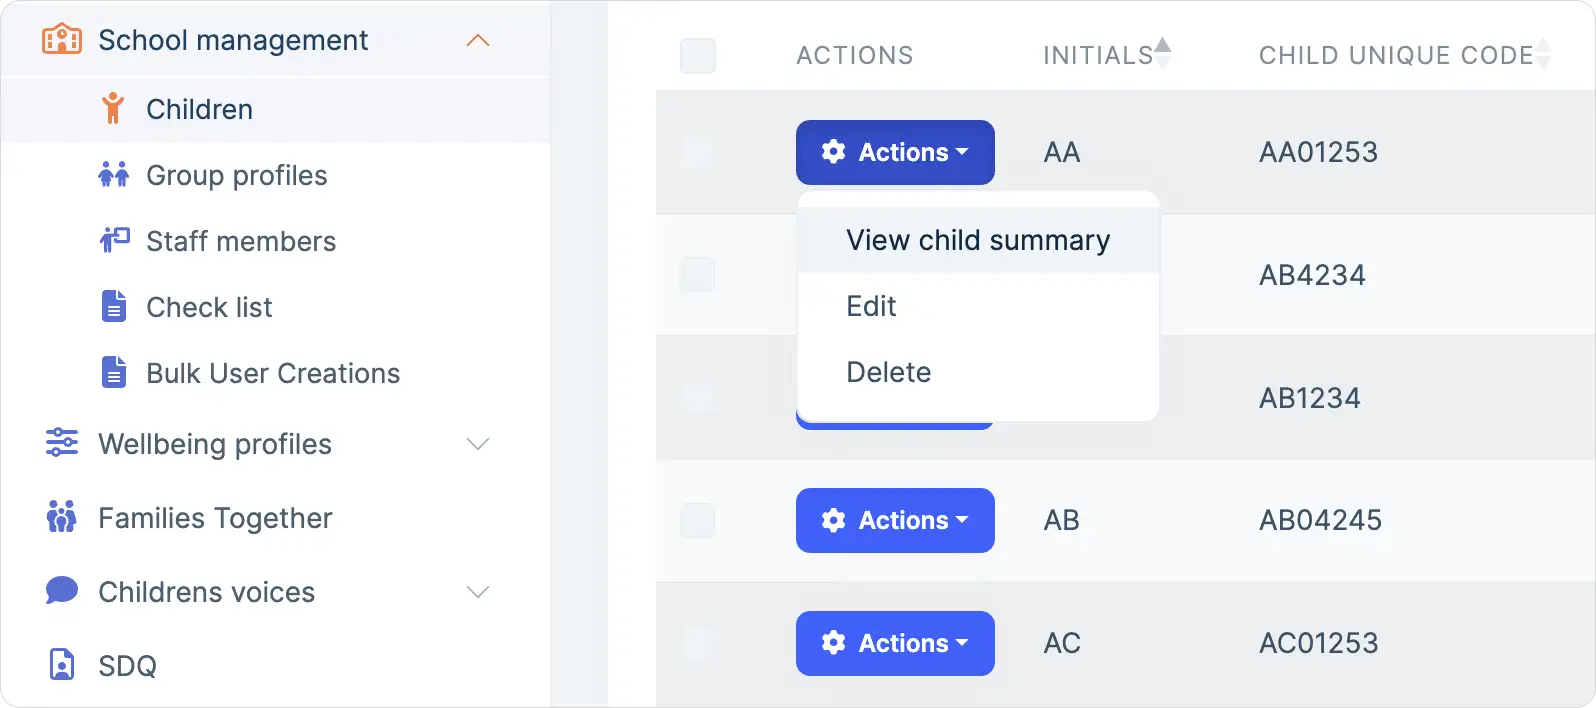
- Select ‘School management’
- Select ‘Children’
- Select the child you wish to view, and right-click to ‘View child summary’
- You will then see the summary data for that child for all the interventions they have participated in. You can also drill down on the programme name to view the microdata.
NEW Archive children facility
We received feedback, especially from schools with hundreds of children participating in Hamish & Milo interventions, to make it easier to manage the lists of children and select children when creating new groups. So we have added child archive functionality.
When a child is archived, they’ll no longer appear in drop-down lists when you are setting up groups, making navigation quicker and simpler. Don’t worry, though; any archived children will still appear within any groups they’ve previously participated in, so you can continue to view their historic results and progress.
- Select ‘School management’
- Select ‘Children’
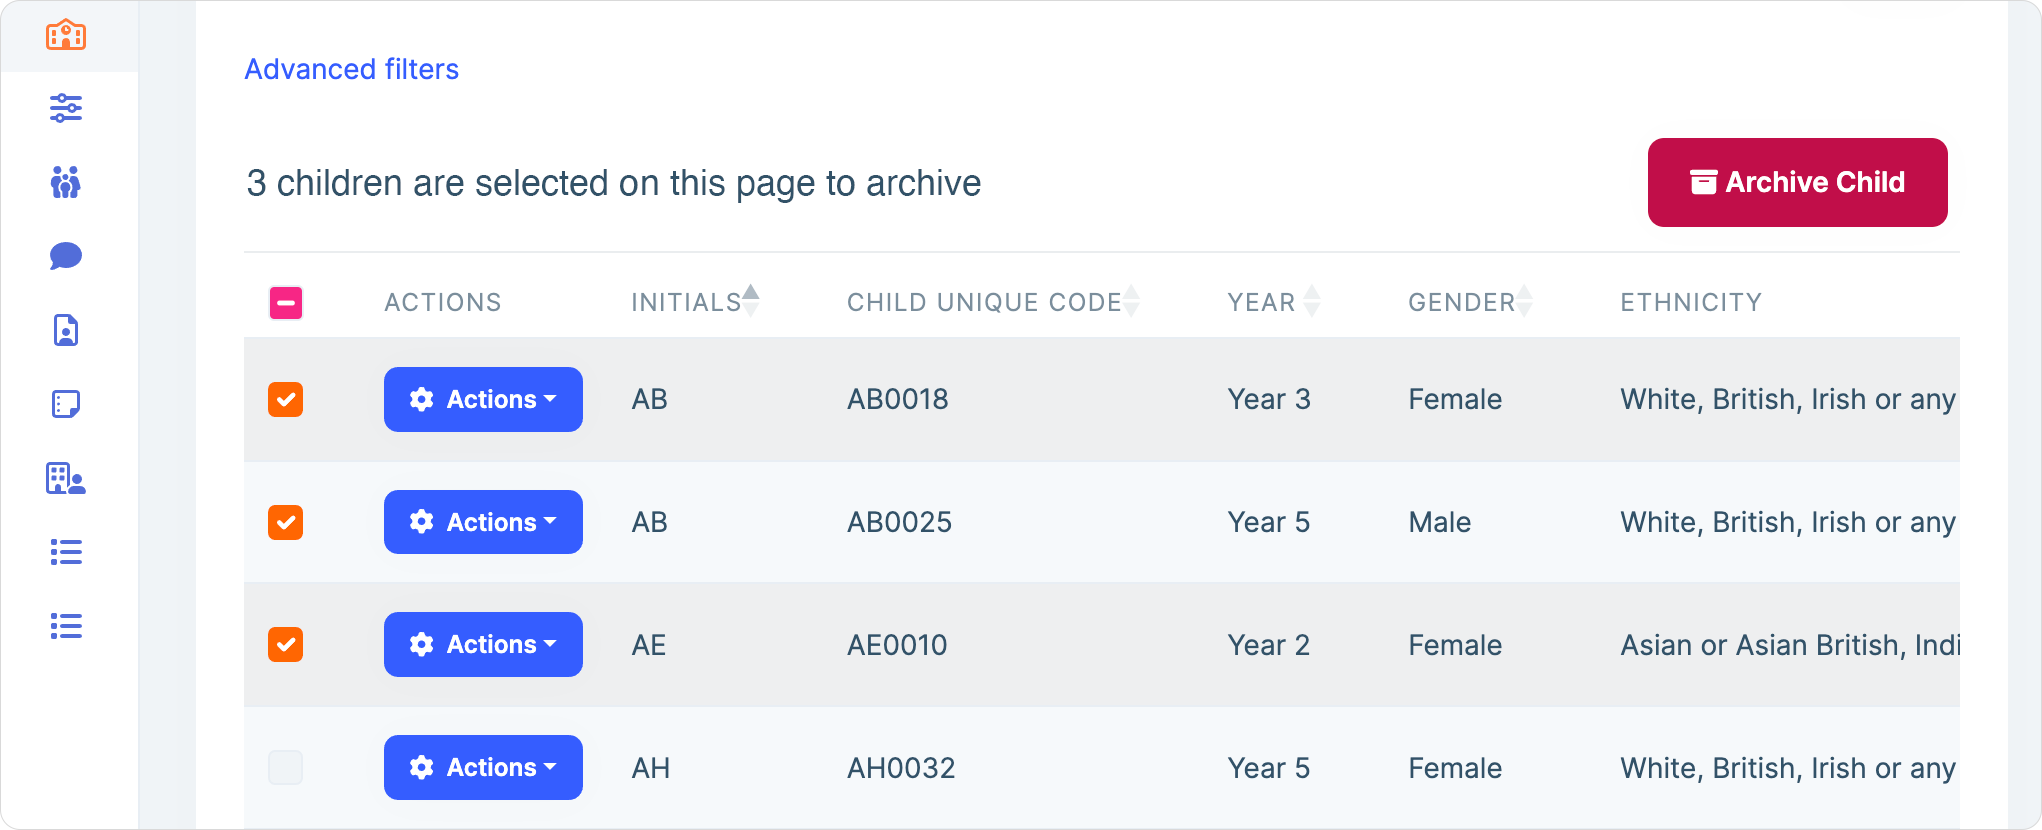
- Select the children you wish to archive using the tick box options down the left-hand side (orange) or selecting the collective ‘all’ tick box at the top (pink).
- Then click the ‘Archive Child’ red button.